pthomas215
1,251 posts
msg #135223
- Ignore pthomas215 |
4/1/2017 12:58:40 PM
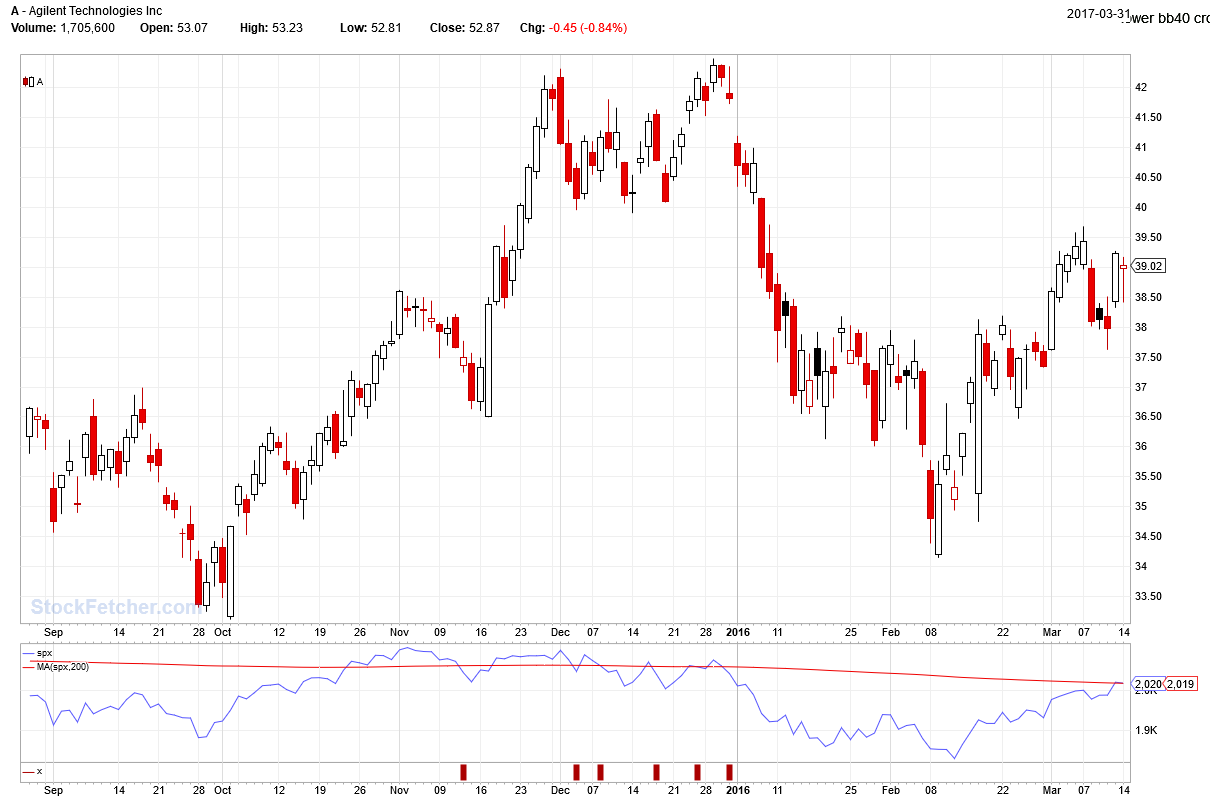
I am wondering if anyone has a filter for charting the relationship between the SP500 price level and its 200-day SMA. Meaning showing where when the SP500 breaks below the 200-day SMA, it would indicate a potential sell-signal. any thoughts are appreciated.
|
four
5,087 posts
msg #135224
- Ignore four |
4/1/2017 1:39:27 PM
|
four
5,087 posts
msg #135225
- Ignore four
modified |
4/1/2017 1:42:43 PM
|
pthomas215
1,251 posts
msg #135226
- Ignore pthomas215 |
4/1/2017 1:46:00 PM
Thank you four. and of course assist to kevin.
|
four
5,087 posts
msg #135228
- Ignore four |
4/1/2017 2:01:17 PM
welcome
|