| StockFetcher Forums · General Discussion · I missed GS ... and JPM | << 1 2 3 >>Post Follow-up |
| arimont 57 posts msg #133692 - Ignore arimont |
1/12/2017 5:16:21 AM I tweaked a bit the filter to suit my preferences. I doesn't bring up results each day, when it does the stock has already made a major move upwards but it continues to run in the LONG direction for a few more days (usually 1-3). I backtested it using "offset" from December until today (27 days). Here are the results for Dec-Jan: Dec 1 - SGY Dec 2 - BAK Dec 6 - FRAN Dec 8 - CIEN (this one didn't work) Dec 9 - EBS Dec 20 - ACAD (this one didn't work until a few days later) Dec 28 - KATE Jan 4 - BX Jan 6 - ETRM Jan 9 - TWOU Jan 11 (resulted today so its not in the stats yet)) - MYOS 8 out of 10 moved up the day after showing on the filter (80%!). I still didn't traded this filter. My guess would be to run it just before EOD and buy at close. As for exits - each one with his own strategy. Anyone care to help me improve this? |
| pthomas215 1,251 posts msg #133693 - Ignore pthomas215 |
1/12/2017 10:03:53 AM MAC, you have good chart IQ..ABCO gapped up 5 points today. maybe DYN will do the same. |
| pthomas215 1,251 posts msg #133700 - Ignore pthomas215 |
1/12/2017 12:38:08 PM AIRMONT, great filter. I don't have suggestions for improvement, but rather would run the stock through RSI and Williams % right away to see if you should go long or short. |
| Mactheriverrat 3,178 posts msg #133701 - Ignore Mactheriverrat |
1/12/2017 12:55:55 PM Roger that on ABCO. I'm sure there will be some profit taking for a couple days now but more upside for ABCO in the long tern. Look at BAC,AKS,X charts on a runs they had . All are showing weakness now but they were great runs IMHO. |
| pthomas215 1,251 posts msg #133702 - Ignore pthomas215 |
1/12/2017 1:07:09 PM you bet. do you think EXEL will break resistance? It is an interesting one to look at. I held it overnight but got out too early I believe. |
| Mactheriverrat 3,178 posts msg #133704 - Ignore Mactheriverrat |
1/12/2017 3:13:30 PM EXEL Good chance it will. Both short and long term averages are trending up. Expanding Bollinger Bands 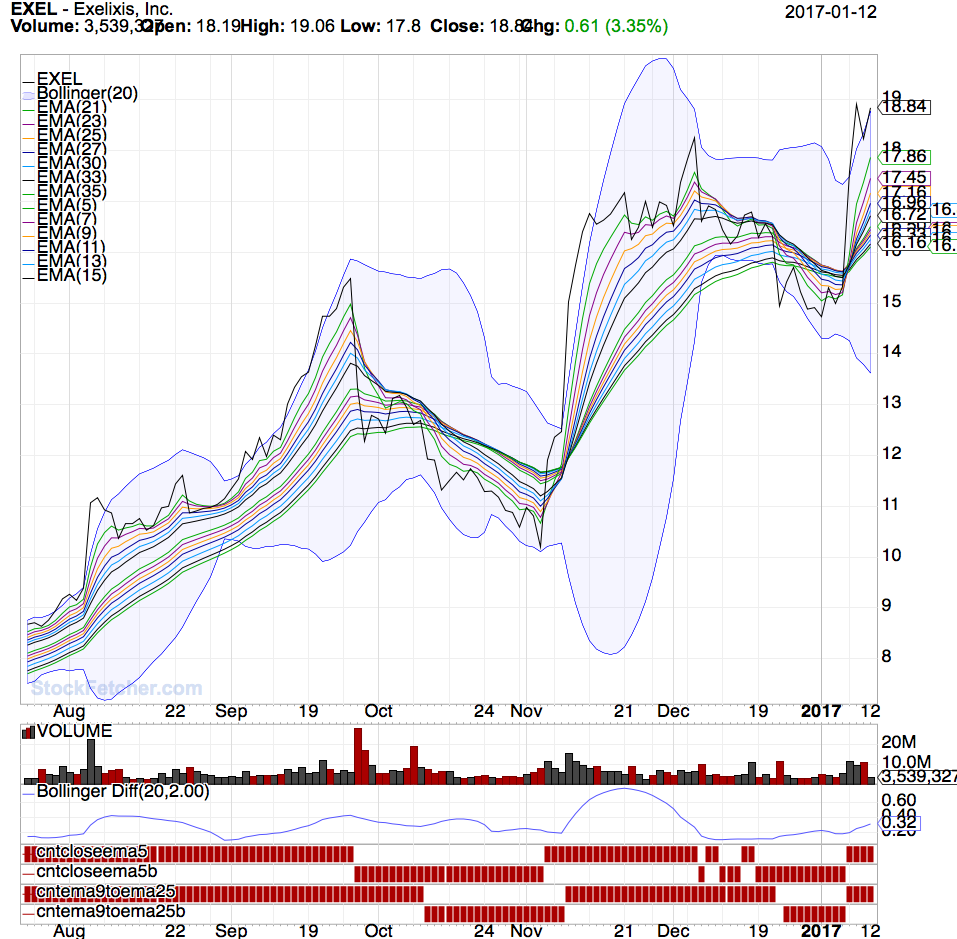 |
| Mactheriverrat 3,178 posts msg #133718 - Ignore Mactheriverrat modified |
1/13/2017 3:59:46 PM To me its boils down to what's inside the box. Short term averages rolling over above the longer term averages. Making the longer term averages roll over in a up trend. Expanding Bollinger Bands. First code line is Price above ema(13) Second code line is ma(20) above ma(20) one day ago which is really the center line of the Bollinger Band(20,2) See as in ABCO as expected today in profit taking. 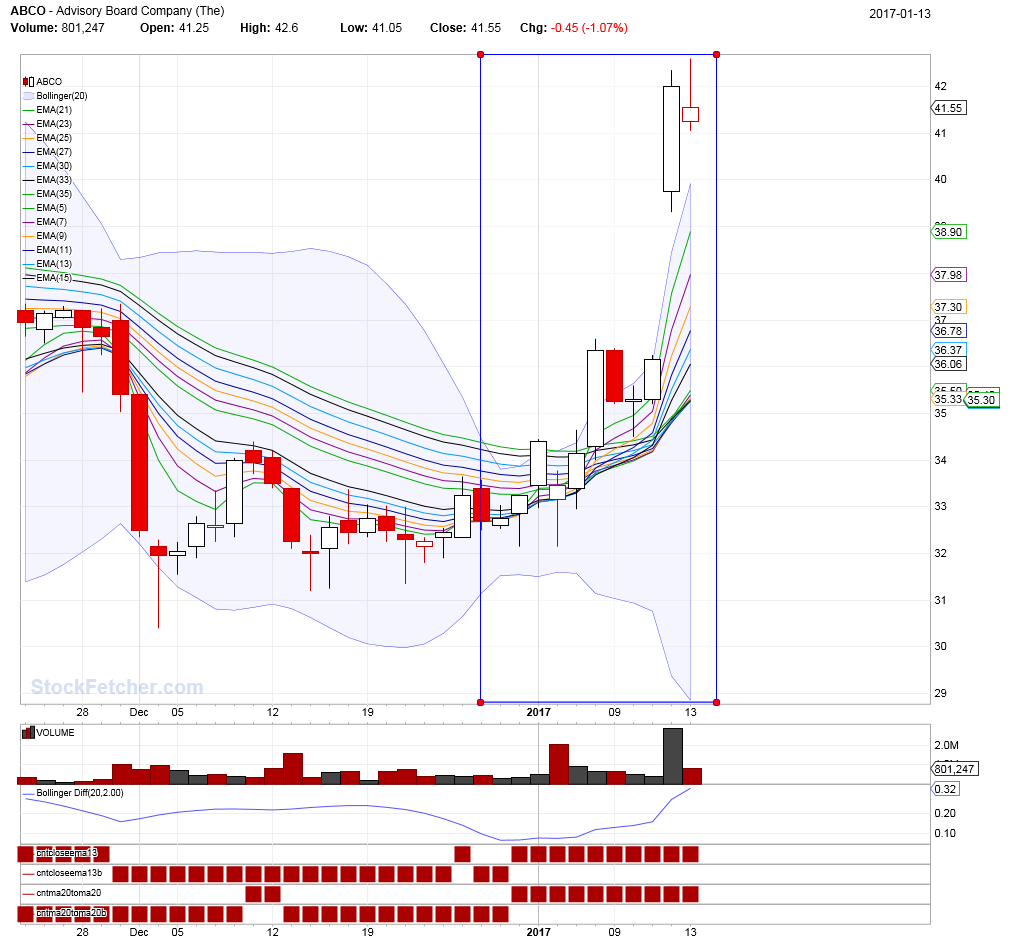 and as in UUUU of what can be. 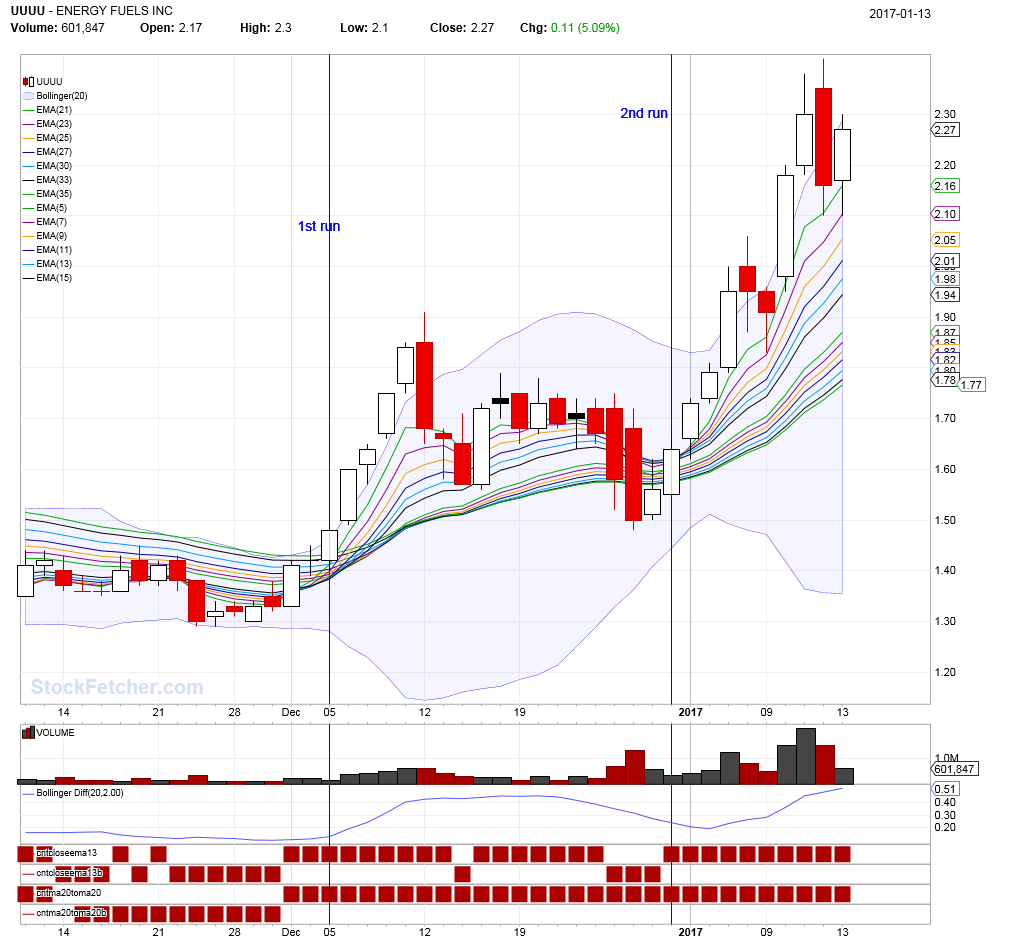 |
| pthomas215 1,251 posts msg #133719 - Ignore pthomas215 |
1/13/2017 5:02:04 PM very cool mac. have you written stockfetcher code to emulate this? |
| Mactheriverrat 3,178 posts msg #133720 - Ignore Mactheriverrat |
1/13/2017 5:56:48 PM Set{cntcloseema13,count( price > ema(13) 1day ago,1)} draw cntcloseema13 Set{cntcloseema13b,count( price < ema(13) 1day ago,1)} draw cntcloseema13b Set{cntMA20toMA20,count( ma(20) > MA(20) 1day ago,1)} draw cntMA20toMA20 Set{cntMA20toMA20b,count( ma(20) < ma(20) 1day ago,1)} draw cntMA20toMA20b AxA is number of consecutive days ema(5) above (+)/below(-) previous ema(21) and set{AAb,days( ema(5) is above ema(21)1 day ago,100)} set{AAa,days( ema(5) is below ema(21) 1 day ago,100)} set{AxA, AAa - AAb} and add column AxA {A_x_A} do not draw AxA --------------------------- I search using AxA for the first day (1) . Look for moving averages rolling over, and BB bands starting to expand, One can use the same averages in this thread for short term and long term averages. Make a symlist of BAC,AKS,X,AMD study them as when there last bullish trend started . One can see where real trends really start |
| pthomas215 1,251 posts msg #133722 - Ignore pthomas215 |
1/13/2017 7:05:59 PM thanks mac. in the interest of sharing info, I added rsi and ift to view your filter and see whether selected stocks are overbought. Ive had good luck lately finding those with upward trending rsi and ift, with rsi below 70 |
| StockFetcher Forums · General Discussion · I missed GS ... and JPM | << 1 2 3 >>Post Follow-up |